
If you're evaluating Product Information Management (PIM) software — or wondering whether your current setup is delivering value — you’re in the right place.
This guide breaks down:
-
What ROI means in the context of PIM
-
What factors influence it
-
How to measure PIM ROI with real business metrics
If you’re ready for real-world examples and a hands-on ROI calculator, jump to Part 2 here →.
What Is ROI in Product Information Management?
ROI (Return on Investment) is a way to measure how much value you're getting for what you’ve spent. In plain terms: is it worth it?
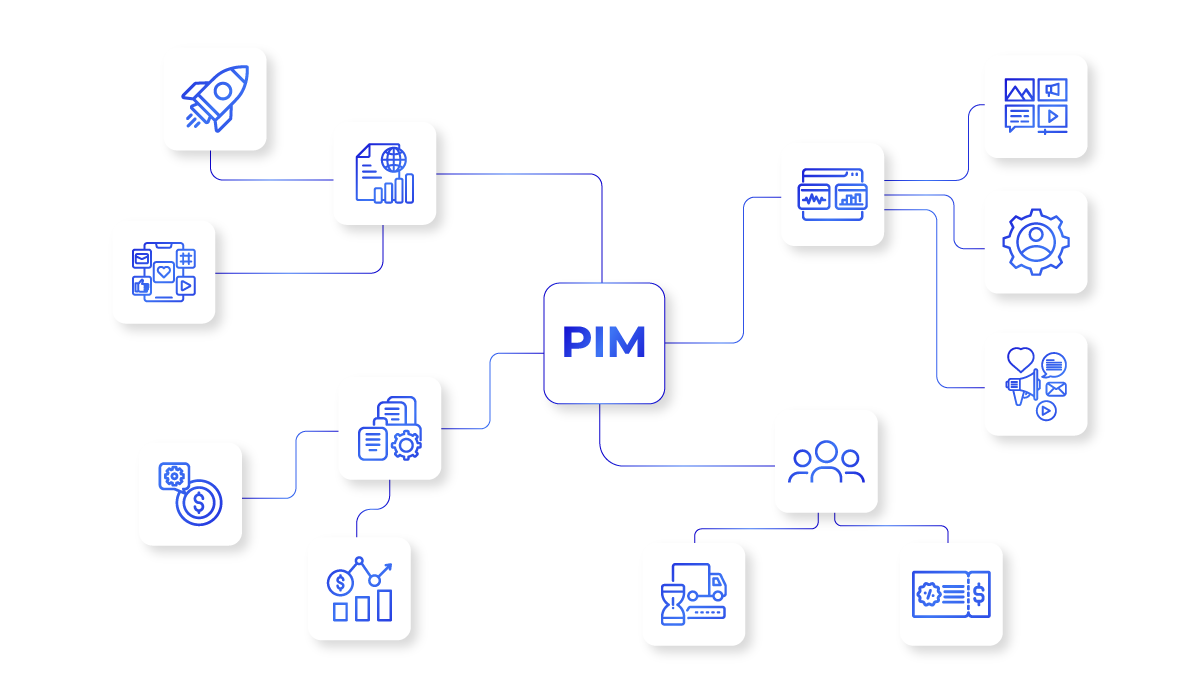
With PIM, it’s not just about the software cost. It’s about what you gain: clean data, faster workflows, better teamwork, and smoother launches.
Key Factors That Shape the ROI of a PIM System
No two businesses will get the exact same results from a PIM system. Your ROI depends on a mix of things — where you’re starting, what your current systems look like, and what your goals are.
Here’s what makes a difference:
-
The state of your product data – if your product information is scattered across systems or files, or heavily relies on manual processes, a PIM system will make a bigger impact — and fast.
-
Your current tech setup – the easier it is to integrate PIM with your existing systems, the faster you’ll see results.
-
Your team’s readiness – do you have the team and processes in place to support a rollout? That matters more than you might think.
-
Your scale and scope – if you manage multiple brands, markets, or languages, the value of having one central hub grows quickly.
Who Should Be Involved in Assessing PIM ROI?
Hint: it’s not just IT and finance.
PIM touches a lot of teams, so it's smart to get input from all the right people:
-
Product Management / Merchandising – owns product structure, pricing, and data updates – key inputs to PIM effectiveness.
-
E-commerce – impacted by product data quality across channels, affecting conversion rates, consistency, and time-to-market.
-
Marketing – relies on accurate, enriched content to maintain brand integrity and deliver high-performing campaigns.
-
Sales – depends on complete, reliable product info to support sales enablement, quoting accuracy, and faster deal cycles.
-
Data / Content Teams – handles the operational load of managing product data – benefiting directly from automation and centralization.
-
Finance – responsible for validating ROI through measurable cost savings, efficiency gains, and revenue growth.
How to Assess ROI in a Structured Manner
To move beyond assumptions, a structured approach to ROI evaluation is essential. Here’s how to build it.
Define Clear Objectives
A strong ROI assessment starts with clear business and operational goals. What are you really trying to achieve? Goals could include:
-
Get products to market faster
-
Improve accuracy across all channels
-
Support more languages or regions
-
Make sure every team is working from the same product information
Whatever your goals are, they’ll shape the rest of your ROI assessment.
Select KPIs and Metrics
To truly measure ROI, choose a mix of both quantitative and qualitative metrics that reflect real business impact.
Quantitative Metrics with KPIs
-
Time saved per product launch
-
Increase in sales from improved product content
-
Drop in product returns due to incorrect info
-
TCO (Total Cost of Ownership) reduction
-
Fewer manual edits and faster localisation
-
Greater SKU content completeness
-
Improved channel consistency
Qualitative Metrics with KPIs
-
Team collaboration
-
Brand consistency
-
Data governance confidence
-
Customer experience improvements
Establish a Baseline
Without a "before" snapshot, you can’t quantify the "after."
Capture current performance benchmarks across key areas like:
-
Time required to launch a new product online
-
Average number of data correction cycles per product
-
Lead time from data entry to channel publication
Include Full Implementation and Operating Costs
Factor in:
-
Licensing and software costs
-
Internal labor (project management, IT resources)
-
External services (consulting, integration partners)
-
Training and onboarding
-
Ongoing support and maintenance
This is essential for a realistic ROI projection.
ROI vs. TCO: What's the Difference?
-
ROI = What you gain (speed, accuracy, revenue)
-
TCO = What you spend (software + labour + maintenance)
Evaluating both is critical when comparing PIM platforms or making long-term investment decisions.
What Real PIM ROI Looks Like
When implemented effectively, a PIM system delivers:
-
Speed: launch products faster and sell sooner
-
Consistency: deliver accurate content across all channels
-
Scale: expand into new regions or platforms without increasing chaos
-
Confidence: give your teams the tools to do better work — without bottlenecks
And as your business grows — more products, more channels, more markets — PIM helps you keep it all running without burning out your team.
Calculate Your PIM ROI Now
Now that you know what PIM ROI looks like — and how to measure it — it’s time to see it in action.
Head over to Part 2 of this series where we break down real examples, show you how to use our ROI calculator, and help you get a clearer picture of what’s possible.
Curious what that might look like for your business?
Book a demo and let us show you. We’ll walk through your numbers, your challenges, and your goals — and help you see exactly where PIM can make a difference.
Quickly see your return — just slide, click, and calculate!
Use our interactive ROI Calculator to input your numbers and uncover real-time insights in seconds.
ROI Of PIM Summary Result
Number of Products
How many products or SKUs do you need to onboard and/or enrich?
Average Number of Attributes per Product
How many attributes do you need to input or edit per product or SKU?
Average Time Spent on Each Attribute (in seconds)
Average Hourly Net Labour Cost (for employees handling data work)
Languages
Number of languages in which your product data will be available.
Sales Channels
Number of sales channels you plan to sell on.
STEP 1 SUMMARY
Your Current Cost of Manual Data Handling
Number of attirbute fields you need to update manually
Time spent on manual work
Your cost of manual work

- 0%
- 25%
- 50%
- 75% 100%
- Underperforming or outdated PIM
- Multi-purpose, or generic centralization Systems like ERP / MDM are used with their limited connectivity and enrichment features
- Basic tools, partial data centralization Simple ecommerce catalog, very limited data exchange, many manual updates
- Manual process, scattered data
STEP 2 SUMMARY

(With an average of 20 working days a month and 8 hours a day, saving hours annually is equivalent to the work of full-time jobs over the course of a month.)
(The average monthly full-time salary in the EU is €3,166 gross, so a saving of $ x.xx is roughly equivalent to full-time jobs.)
You want to launch
How long to launch 23,772 products without Bluestone PIM?
What is your Average Revenue Per Unit (ARPU)?
How much money does your company expect to earn on average from selling a unit of a product?
What is your average Daily Unit Sales Per Product?
On average, how many units of a product do you sell each day?
STEP 3 SUMMARY
100 products x 5 sales each per day = 500 sales/daily.
500 sales for $
Summary of Step 1 + Step 2 + Step 3
Your Combined Savings and Revenue Increase with Bluestone PIM
$ x.xx cost savings + $ revenue increase
You're one step away from knowing the real ROI your business can unlock with PIM.
Do you want to maximise the ROI with Bluestone PIM even further?
Elevate your savings with Bluestone PIM's advanced AI features
See what you’re spending on copywriting — and how much you could save with AI in PIM
Calculate your translation costs and discover the savings with AI Linguist in PIM.
Number of Products Needing Descriptions
Average Word Count per Product Description
Number of Attributes per Product
Attributes Length Characters
Your Manual/Human Copywriting Cost per Word
Your Current Human Copywriting Cost
to create product attributes and descriptions for products
The AI calculates costs based on the number of input and output tokens, with each token representing approximately four characters. The cost per token varies depending on the model used.
Basic GPT Model: Less powerful, lower cost, produces simpler or less detailed responses, and might be faster due to smaller size or fewer computations.
Advanced AI Model: More powerful, higher cost, produces higher-quality and more detailed responses, but could be slower because of increased computational complexity.
Pricing for AI models often decreases with each new release, making advanced processing more cost-effective over time.
Your AI Enrich Cost Estimation
Number of Products Requiring Translation
Number of attributes per product
Attributes Length Characters
Average Word Count per Product Description
Number of Languages
Your Human Translator Cost per Word
Your Current Human Translator Cost
to translate product attributes and descriptions for products in languages
The AI calculates costs based on the number of input and output tokens, with each token representing approximately four characters. The cost per token varies depending on the model used.
Basic GPT Model: Less powerful, lower cost, produces simpler or less detailed responses, and might be faster due to smaller size or fewer computations.
Advanced AI Model: More powerful, higher cost, produces higher-quality and more detailed responses, but could be slower because of increased computational complexity.
Pricing for AI models often decreases with each new release, making advanced processing more cost-effective over time.